Debug kernel with KGDB
What is KGDB?
KGDB intend to be used as a source code level debugger on a running Linux kernel. It works with GDB and allows the user to inspect memory, variables, setup breakpoints, step lines and instructions. Pretty much the same that all application developers are used to, but for the kernel itself.
Almost every embedded Linux system does have a serial port available, and that is all that you need to connect GDB to your kernel.
One thing to keep in mind, as with all debugging, is that everything that is called timing will be messed up. It will be pretty obvious when you actually pause a running kernel that keeps up the communicates with all hardware. Especially if you have any hardware watchdogs enabled...
Compile the kernel with support for KGDB
There are a few kernel options that you have to enable in order to use KGDB:
- CONFIG_KGDB to enable remote debugging.
- CONFIG_KGDB_SERIAL_CONSOLE let you share a serial console with GDB.
- CONFIG_FRAME_POINTER is used to produce more reliable stack backtraces by inserting code to preserve the frame information in registers or on the stack.
- CONFIG_KALLSYMS_ALL to make sure that all symbols are loaded into the kernel image (i.e. symbols from all sections).
- CONFIG_MAGIC_SYSRQ to be able to make sysrq. More about this below.
KGDBOC
KGDB over console, or kgdboc, let you use a console port as the debugging port. If we only have one serial port available, we could split the console and gdb communication using agent-proxy [2] .
Agent-proxy
To split a serial port into console and GDB communication we could use agent-proxy. Download and compile agent-proxy
git clone http://git.kernel.org/pub/scm/utils/kernel/kgdb/agent-proxy.git
cd agent-proxy
make
Launch agent-proxy
agent-proxy 4440^4441 0 /dev/ttyS0,115200
If your hardware does not support the line break sequence you have to add the -s003 option. You will find out pretty soon if it's needed - if your target continues to run after sending a break, then you should try to add it, in other words:
agent-proxy 4440^4441 0 /dev/ttyS0,115200 -s003
Where ttyS0 is the serial port on your host.
This will create two TCP sockets, one for serial console and with for GDB, which is listening to port 4440 and 4441 respectively.
Connect to the serial console with your favorite client (socat, netcat, telnet...)
telnet localhost 4440
Setup kgdboc with kernel arguments
kgdboc could be used early in the boot process if it's compiled into the kernel as a built-in (not as module), by providing the kgdboc arguments.
Add kgdboc=<tty-device>,[baud] to your command line argument, e.g.
kgdboc=ttyS0,11500
Where ttyS0 is the serial port on the target.
The kgdbwait argument stops the kernel execution and enter the kernel debugger as earliest as possible. This let you connect to the running kernel with GDB.
See kernel parameters [1] for more information.
Setup kgdboc with kernel module
If the kgdb is not compiled to be built-in but as a module, you provide the same arguments while loading the kernel
modprobe kgdboc=ttyS0,115200
Setup kgdboc in runtime using sysfs
It's also possible to enable kgdboc by echoing parameters into sysfs entries
echo ttyS0 > /sys/module/kgdboc/parameters/kgdboc
Connect GDB to a running kernel
Stop execution and wait for debugger
We have to stop the execution of the kernel in order to connect with gdb.
If gdbwait is provided as boot argument, the kernel will stop its execution and wait.
Otherwise we have to trigger this manually by using SysRq-G. This requires that the CONFIG_MAGIC_SYSRQ is enabled in your kernel config.
Your favorite serial application does probably have some keyboard combination to send SYSRQ requests (GNU Screen has "CTRL+A b" for example), otherwise you can use procfs to send the trigger
echo g > /proc/sysrq-trigger
Connect with GDB
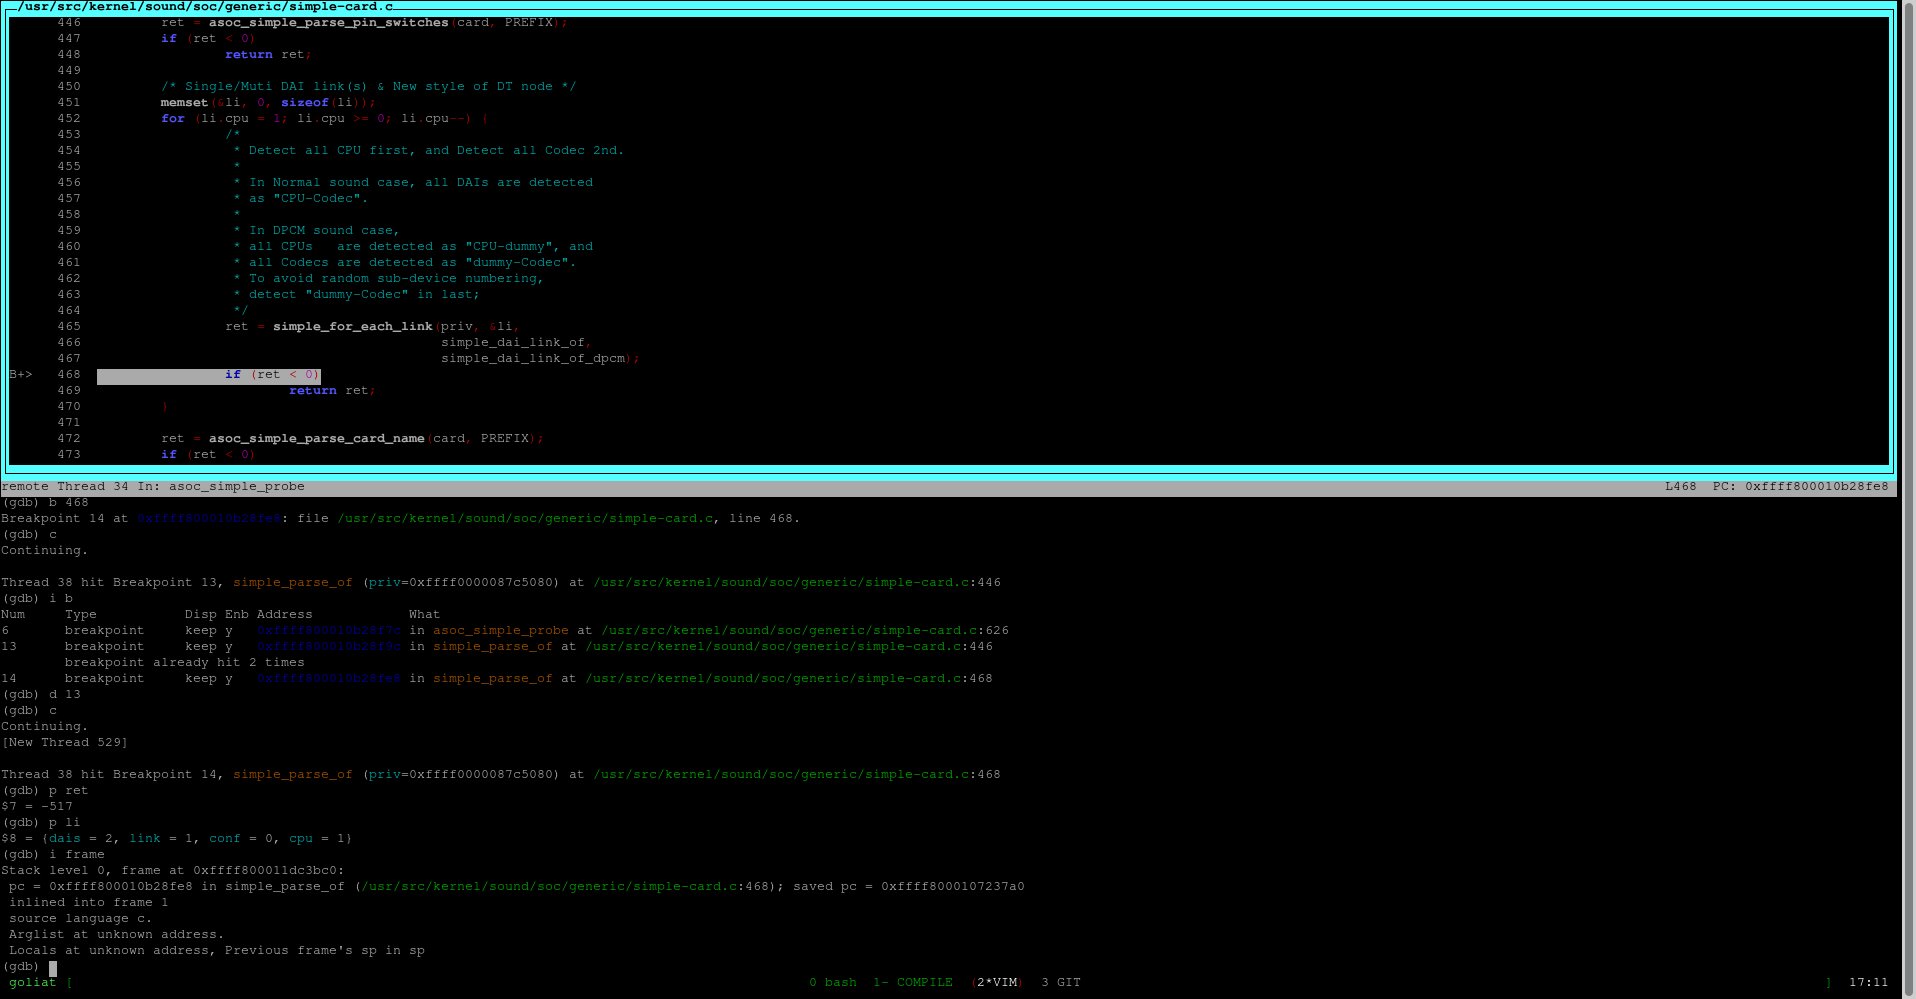
Start GDB and provide the vmlinux from your kernel root directory, remember that you have to use the GDB that came with your toolchain. I do always use the -tui flag to start with a nice terminal user interface
aarch64-linux-gnu-gdb -tui ./vmlinux
Now, if you have a separate serial port for gdb, you could connect to it directly
(gdb) set remotebaud 115200
(gdb) target remote /dev/ttyS0
If you are using agent-proxy, then we should connct to port 4441
(gdb) target remote localhost:4441
Now you are able to set breakpoints, watch variables and use gdb as you used to.

One tip is to set a breakpoint at ksys_sync
(gdb) b ksys_sync
This let you run the sync command as trig to go-to-debug-mode.